
The image below describes how to locate different types of information on this tool.
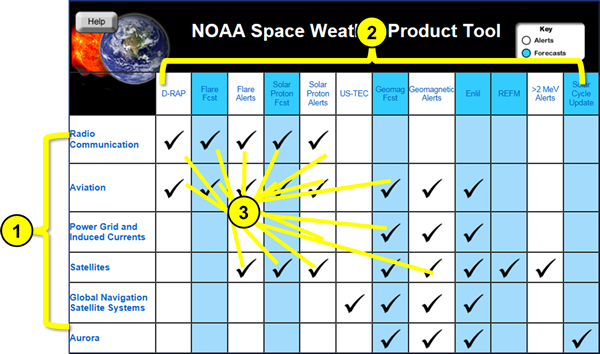
Descriptions of the areas identified by the numbers in the image are listed below.
1.The first column contains a list of targeted customers. Placing your cursor over any of the words listed in the first column provides a brief description of the particular customer identified and the impacts of space weather for that customer.
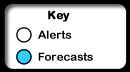
2.The top row lists available resources. Resources presented in white font with a black background provide current conditions while resources presented with a black font on a blue background provide forecasted conditions. Placing your cursor over any of the items listed in the top row provides a brief description of the resource in question.
3.Check marks indicate if a particular tool (vertical) is designed for an identified customer (horizontal). Placing your cursor over any check mark provides a brief explanation of how the particular tool (vertical) can assist the identified customer (horizontal).
The D-Region Absorption Predictions (D-RAP) Model is a quick reference visual tool that identifies regions that will experience signal degradation or radio blackout conditions due to effects from X-ray flares or Solar Energetic Particle (SEP) events.
The D-RAP Model addresses the operational impact of the solar X-ray flux and SEP events on High Frequency (HF) radio communication. It can be found at the following address: http://www.swpc.noaa.gov/products/d-region-absorption-predictions-d-rap
The model uses 1 minute (0.1-0.8 nm) X-ray Flux data and 5 minute averaged 10 MeV Proton Flux data provided by the Space Environment Monitor aboard the Geostationary Operational Environmental Satellites (GOES).
Four Dynamic Components
- Frequency Maps -The global and polar frequency maps graphically illustrate the Highest Affected Frequency (HAF) as a function of latitude and longitude.
- Attenuation Bar Graph - A bar graph on the right-hand side of the graphic displays the expected attenuation in decibels as a function of frequency for vertical radio wave propagation at the point of maximum absorption Amax on the globe. This graph is only valid at this point, although users can re-create it for any location using the tabular data.
- Status Messages- Text messages appear at the bottom of the frequency map describing the current levels of X-ray Flux and Proton Flux being observed.
- Estimated Recovery Clock - The program uses the current X-ray and proton flux data to re-calculate the estimated recovery time every minute.
Related Topics: Radio Communication | Aviation
Options: Return to the Space Weather Tool | Open the D-RAP Model in a new window.
Flare forecasts indicate the percent chance that a high level X-ray event may occur during the following three days. X-ray flares are associated with impacts on HF radio propagation, ranging from weak degradation to complete radio blackout conditions along with Low-frequency navigation signal degradation causing position errors.
Flare forecasts are daily probabilistic forecasts, ranging from 1% to 99%, of the likelihood of an M class (or X class) X-ray flare occurring within the specified 24-hour day. Flare forecasts are part of the 3-day Forecast and Forecast Discussion products sent twice daily at 00 UTC and 12 UTC by the Space Weather Prediction Center.
The M1 X-ray flare threshold is 10-5 Watts / m2 X-ray flux in the 0.1 to 0.8 nm passband as measured by the NOAA GOES spacecraft.
The X1 X-ray flare threshold is 10-4 Watts / m2 X-ray flux in the 0.1 to 0.8 nm passband as measured by the NOAA GOES spacecraft.
The NOAA Space Weather Scale for Radio Blackouts describes the effects that can be experienced as the result of ionospheric disturbances caused by X-ray emissions from the Sun.
Related Topics: Radio Communication | Aviation
Options: Return to the Space Weather Tool | Open the Three-day X-Ray Forecast in a new window.
Flare alerts indicate that a high level X-ray event is currently in progress. X-ray flares are associated with impacts on HF radio propagation, ranging from weak degradation to complete radio blackout conditions along with Low-frequency navigation signal degradation causing position errors.
Flare Alerts are disseminated when the X-ray Flux has reached the M5 X-ray flare threshold of 5x10⁻⁵ Watts / m2 X-ray flux in the 0.1 to 0.8 nm passband as measured by the NOAA GOES spacecraft.
Flare Summaries are sent at the end of a significant flare event to notify customers of the maximum X-ray Flux reached.
The NOAA Space Weather Scale for Radio Blackouts describes the effects that can be experienced as the result of ionospheric disturbances caused by X-ray emissions from the Sun.
Related Topics: Radio Communication | Aviation
Options: Return to the Space Weather Tool | Open the Notifications Timeline in a new window.
Proton forecasts indicate the percent chance that a proton event may occur during the following three days. Proton events are associated with impacts on HF radio communication, satellite operations and can be biologically hazardous to astronauts or aircrew at high latitudes.
Proton forecasts are daily probabilistic forecasts, ranging from 1% (0.01) to 99% (0.99), of the likelihood of greater than 10 MeV Proton Event occurring within the specified 24-hour day. Proton forecasts are part of the 3-day Forecast and Forecast Discussion products sent twice daily at 00 UTC and 12 UTC by the Space Weather Prediction Center.
The event threshold for Proton Flux is 10 pfu (particle flux unit = particles / cm2-s-sr) at greater than 10 MeV as measured by the NOAA GOES spacecraft.
The NOAA Space Weather Scale for Radiation Storms describes the effects that can be experienced as the result of elevated levels of radiation that occur when the numbers of energetic particles increase.
Related Topics: Radio Communication | Aviation | Satellites
Options: Return to the Space Weather Tool | Open the 3-day Proton Event Probability Forecast in a new window.
Proton alerts indicate that a proton event is currently in progress. Proton events are associated with impacts on HF radio communication, satellite operations and can be biologically hazardous to astronauts or aircrew at high latitudes.
Proton Alerts are disseminated when the Proton Flux is 10, 102, 103, 104 and 10 5 pfu (particle flux unit = particles / cm2-s-sr) at greater than 10 MeV as measured by the NOAA GOES spacecraft.
A separate alert is issued when the Proton Flux is 1 pfu at greater than 100 MeV as measured by the NOAA GOES spacecraft.
Proton Summaries are sent at the end of a significant flare event to notify customers of the maximum Proton Flux reached during the event.
The NOAA Space Weather Scale for Radiation Storms describes the effects that can be experienced as the result of elevated levels of radiation that occur when the numbers of energetic particles increase.
Related Topics: Radio Communication | Aviation | Satellites
Options: Return to the Space Weather Tool | Open the Notifications Timeline to see current Alerts in a new window.
Geomagnetic storm forecasts reveal the geomagnetic activity levels expected for the following three days. Geomagnetic storm events are associated with impacts on power systems and spacecraft operations, along with effects on HF radio propagation, oil pipelines and satellite navigation. In addition, when geomagnetic activity is low, the aurora borealis typically is located, in the hours around midnight, at about 67 degrees corrected magnetic latitude. As activity increases, the region of aurora expands toward the equator. When geomagnetic activity is very high, the aurora may be seen at mid and low latitude locations around the Earth that would otherwise rarely experience the polar lights.
Geomagnetic Storm Forecasts are daily forecasts, indicating the Planetary K-Index (Kp) value expected for each 3 hour synoptic period for the following 3 days. The statistical occurrences of the different Kp levels are as follows:
- Kp>5: Occurs approximately 1700 times per 11 year Solar Cycle
- Kp>6: Occurs approximately 600 times per 11 year Solar Cycle
- Kp>7: Occurs approximately 200 times per 11 year Solar Cycle
- Kp>8: Occurs approximately 100 times per 11 year Solar Cycle
- Kp>9: Occurs approximately 4 times per 11 year Solar Cycle
The NOAA Space Weather Scale for Geomagnetic Storms describes the effects that can be experienced as the result of disturbances of the Earth's magnetic field caused by Coronal Mass Ejections (CMEs) or Coronal Hole High Speed Streams from the Sun.
Related Topics: Power Grids | Aviation | Satellites | GNSS | Aurora
Options: Return to the Space Weather Tool | Open the 3-day Geomagnetic Activity Forecast in a new window.
Geomagnetic storm alerts indicate that a geomagnetic storm event is currently in progress. Geomagnetic storm events are associated with impacts on power systems and spacecraft operations, along with effects on HF radio propagation, oil pipelines and satellite navigation. In addition, when geomagnetic activity is low, the aurora borealis typically is located, in the hours around midnight, at about 67 degrees corrected magnetic latitude. As activity increases, the region of aurora expands toward the equator. When geomagnetic activity is very high, the aurora may be seen at mid and low latitude locations around the Earth that would otherwise rarely experience the polar lights.
Geomagnetic Storm Alerts are disseminated when the Planetary K-Index (Kp) value reaches each event threshold. The statistical occurrences of the different Kp levels are as follows:
- Kp>5: Occurs approximately 1700 times per 11 year Solar Cycle
- Kp>6: Occurs approximately 600 times per 11 year Solar Cycle
- Kp>7: Occurs approximately 200 times per 11 year Solar Cycle
- Kp>8: Occurs approximately 100 times per 11 year Solar Cycle
- Kp>9: Occurs approximately 4 times per 11 year Solar Cycle
The NOAA Space Weather Scale for Geomagnetic Storms describes the effects that can be experienced as the result of disturbances of the Earth's magnetic field caused by Coronal Mass Ejections (CMEs) or Coronal Hole High Speed Streams from the Sun.
Related Topics: Power Grids | Aviation | Satellites | GNSS | Aurora
Options: Return to the Space Weather Tool | Open Current Geomagnetic Activity Alerts in a new window.
Geomagnetic storm forecasts reveal the geomagnetic activity levels expected for the following three days. Forecasters use the ENLIL model to gauge arrival time and estimated magnitude of effects from approaching solar events.
The ENLIL model predicts solar wind stream variations for both Coronal Hole High Speed Stream and for Coronal Mass Ejections. The magnitude and duration predicted by the model can assist forecasters in determining the magnitude and duration of associated geomagnetic storms. For more information about the ENLIL model, visit http://www.swpc.noaa.gov/products/wsa-enlil-solar-wind-prediction.
Geomagnetic Storm Forecasts are daily forecasts, indicating the Planetary K-Index (Kp) value expected for each 3 hour synoptic period for the following 3 days.
Related Topics: Power Grids | Aviation | Satellites | GNSS | Aurora
Options: Return to the Space Weather Tool | Open the ENLIL Model in a new window.
Relativistic Electron Forecast Model (REFM)
Satellites can experience deep dielectric or bulk charging when the Earth is immersed in a high speed solar wind stream. The Van Allen belts become populated with high fluxes of relativistic (>1 MeV) electrons. These electrons easily penetrate spacecraft shielding and can build up charge where they come to rest in dielectrics such as coax cable, circuit boards, electrically floating radiation shields, etc. If the electron flux is high for extended periods, abrupt discharges (tiny "lightening strokes") deep in the spacecraft can occur. The Relativistic Electron Forecast Model (REFM) uses solar wind data upstream from Earth to forecast electron flux levels expected over the next 3 days.
REFM forecasts are intended to supplement current SWPC alerts by providing guidance as to the future likelihood of damaging relativistic electron events. Since the REFM output is a daily fluence forecast, not flux, it applies most directly to the high fluence threshold. In fact the graphical model output displays a warning message during periods when the 72-hour fluence exceeds or is forecast to exceed 109 particles/(cm2 sr day). High 24-hour fluence values can also be used as a proxy for high flux levels. A study of data measured between 1995 and 2000 showed that when the 24-hour fluence exceeds 3 × 10⁷ particles/(cm2 sr day) the SWPC flux alert criteria is nearly always met (false alarm ratio = 0.07, miss frequency = 0.06). With this threshold, REFM fluence forecasts can be used to predict SWPC flux alerts.
Output from the REFM, which runs once at the start of each UT day, is made available as both graphical plots and text files on http://www.swpc.noaa.gov/products/relativistic-electron-forecast-model. For more information about the REFM, visit the tabs at the bottom of the REFM page.
Related Topics: Satellites
Options: Return to the Space Weather Tool | Open the Relativistic Electron Forecast Model in a new window.
SWPC issues a >2 MeV Electron Flux Alert when the flux reaches the 1000 pfu threshold. The main customer base for these alerts are Satellite operations due to the possibility of deep dielectric charging.
High fluxes of these electrons vary with the 11 year solar cycle and are most prevalent during the declining phase of the cycle. Occasionally, high-energy electron events recur with a 27-day periodicity - the rotation period of the Sun. Discharges appear to correlate well with long periods of high fluxes. At these times, charge buildup exceeds the natural charge leakage rate of the dielectric. The charge builds and discharge occurs after the breakdown voltage is reached. In the past, some energetic electron enhancements at GEO have approached two weeks in duration. SWPC operates electron flux sensors on the GOES GEO spacecraft. These instruments measure electron fluxes of >0.8 and >2 MeV. (See GOES electron data )
A greater than 2 MeV Electron Alert is issued when the 1000 pfu (particle flux unit = particles / cm2-s-sr) threshold is crossed.
Related Topics: Satellites
Options: Return to the Space Weather Tool | Open the GOES Electron Data in a new window.
Solar activity has a cycle with a duration of approximately 11 years from peak to peak (5.5 years from maximum to minimum). This includes changes in the levels of solar radiation and ejection of solar material due largely to changes in the size, magnetic complexity and prevalence of active sunspot regions. Below is the peak from Solar Cycle 23 and the predicted curve for Solar Cycle 24. SWPC forecasters use this information for long term planning purposes to determine what types of solar activity they should be experiencing and the relative increase or decrease of space weather storms.

The NOAA Space Weather Scales for Geomagnetic Storms, Solar Radiation Storms and Radio Blackouts describe the effects that can be experienced as the result of disturbances of the Earth's magnetic field caused by Coronal Mass Ejections (CMEs) or Coronal Hole High Speed Streams from the Sun. All three types of activity vary throughout the solar cycle.
Related Topics: Aurora
Options: Return to the Space Weather Tool | Open the ISES Solar Cycle Progression Chart in a new window.
High Frequency (HF) Radio Communication can be degraded or reach complete blackout conditions due to X-ray flares or Solar Energetic Particle (SEP) events causing a sudden increase in ionization. Solar energetic particles following Earth’s magnetic field lines can penetrate the upper atmosphere near the magnetic poles, resulting in ionization and creating a polar cap absorption event.
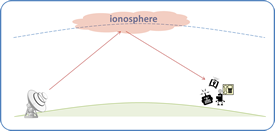 Long-range communications using HF radio waves (3 - 30 MHz) depend on reflection of the signals in the ionosphere. Radio waves are typically reflected near the peak of the F2 layer (~300 km altitude), but along the path to the F2 peak and back the radio wave signal suffers attenuation due to absorption by the intervening ionosphere.
Absorption is the process by which the energy of radio waves is converted into heat and electromagnetic (EM) noise through interactions between the radio wave, ionospheric electrons, and the neutral atmosphere. Most of the absorption occurs in the ionospheric D region (50–90 km altitude) where the product of the electron density and the electron-neutral collision frequency attains a maximum.
Within this region the neutral density is relatively constant over time, so variations in the local electron density drive the total amount of absorption. The electron density is a function of many parameters and normally varies with local time, latitude, season, and over the solar cycle. These "natural" changes are predictable, and affect absorption only moderately at the lowest HF frequencies. Much more significant changes to the absorption strength are seen as a result of sudden increases of electron density in the D region (the classic short wave fade) due to, for example, solar X-ray flares on the dayside or solar proton precipitation in the polar regions.
Related Topics: D-RAP | Flare Forecasts | Flare Alerts | Proton Forecasts
Options: Return to the Space Weather Tool
D-RAP Model/Radio Communication
The D-Region Absorption Predictions (D-RAP) Model is a quick reference visual tool that identifies regions that will experience signal degradation or radio blackout conditions due to effects from X-ray flares or Solar Energetic Particle (SEP) events.
The D-RAP Model addresses the operational impact of the solar X-ray flux and SEP events on High Frequency (HF) radio communication. It can be found at the following address: http://www.swpc.noaa.gov/products/d-region-absorption-predictions-d-rap
Four Dynamic Components associated with Radio Communication
- Frequency Maps - The global and polar frequency maps graphically illustrate the Highest Affected Frequency (HAF) as a function of latitude and longitude.
- Attenuation Bar Graph - A bar graph on the right-hand side of the graphic displays the expected attenuation in decibels as a function of frequency for vertical radio wave propagation at the point of maximum absorption, Amax, on the globe. This graph is only valid at this point, although users can re-create it for any location using the tabular data.
- Status Messages- Text messages appear at the bottom of the frequency map describing the current levels of X-ray Flux and Proton Flux being observed.
- Estimated Recovery Clock - The program uses the current X-ray and Proton Flux data to re-calculate the estimated recovery time every minute.
Related Topics: Radio Communication | Aviation | D-RAP
Options: Return to the Space Weather Tool | Open the D-RAP Model in a new window.
Flare Forecasts/Radio Communication
Flare forecasts indicate the percent chance that a high level X-ray event may occur during the following three days. X-ray flares are associated with impacts on HF radio propagation, ranging from weak degradation to complete radio blackout conditions.
Flare forecasts are daily probabilistic forecasts, ranging from 1% to 99%, of the likelihood of an M-class or X-class X-ray flare occurring within the specified 24-hour day. The forecast does not specify the maximum expected X-ray Flux; it simply provides the percentage chance that the M class or X class X-ray thresholds will be reached.
- M1 Flare (1x10⁻⁵ Watts / m2 ): Area of impact centered primarily on sub-solar point on the sunlit side of Earth; Weak or minor degradation of HF radio communication on sunlit side, occasional loss of radio contact
- M5 Flare (5x10⁻⁵ Watts / m2 ): Area of impact centered primarily on sub-solar point on the sunlit side of Earth; Limited blackout of HF (high frequency) radio communication for tens of minutes
- X1 Flare (1x10⁻⁴ Watts / m2): Area of impact consists of large portions of the sunlit side of Earth, strongest at the sub-solar point; Wide area blackout of HF (high frequency) radio communication for about an hour
- X10 Flare (1x10⁻³ Watts / m2): Area of impact widespread on the sunlit side of Earth, strongest at the sub-solar point; Wide area black out of HF (high frequency) radio communication for one to two hours
- X20 Flare (2x10⁻³ Watts / m2): Area of impact largely the sunlit side of Earth, although strongest at the sub-solar point; Complete HF (high frequency) radio blackout on the entire sunlit side of the Earth lasting for a number of hours. Higher radio frequencies may also be affected
The NOAA Space Weather Scale for Radio Blackouts describes the effects that can be experienced as the result of elevated levels of X-ray Flux.
Related Topics: Radio Communication | Aviation | Flare Forecasts
Options: Return to the Space Weather Tool | Open the 3-day X-Ray Forecast in a new window.
Flare Alerts/Radio Communication
Flare alerts indicate that a high level X-ray event is currently in progress. X-ray flares are associated with impacts on HF radio propagation, ranging from weak degradation to complete radio blackout conditions.
Flare Alerts are disseminated when the X-ray Flux has reached the M5 X-ray flare threshold of 5x10⁻⁵ Watts / m2 X-ray flux in the 0.1 to 0.8 nm passband as measured by the NOAA GOES spacecraft.
Flare Summaries are sent at the end of a significant flare event to notify customers of the maximum X-ray Flux reached.
- M1 Flare (1x10⁻⁵ Watts / m2 ): Area of impact centered primarily on sub-solar point on the sunlit side of Earth; Weak or minor degradation of HF radio communication on sunlit side, occasional loss of radio contact
- M5 Flare (5x10⁻⁵ Watts / m2 ): Area of impact centered primarily on sub-solar point on the sunlit side of Earth; Limited blackout of HF (high frequency) radio communication for tens of minutes
- X1 Flare (1x10⁻⁴ Watts / m2): Area of impact consists of large portions of the sunlit side of Earth, strongest at the sub-solar point; Wide area blackout of HF (high frequency) radio communication for about an hour
- X10 Flare (1x10⁻³ Watts / m2): Area of impact widespread on the sunlit side of Earth, strongest at the sub-solar point; Wide area black out of HF (high frequency) radio communication for one to two hours
- X20 Flare (2x10⁻³ Watts / m2): Area of impact largely the sunlit side of Earth, although strongest at the sub-solar point; Complete HF (high frequency) radio blackout on the entire sunlit side of the Earth lasting for a number of hours. Higher radio frequencies may also be affected
The NOAA Space Weather Scale for Radio Blackouts describes the effects that can be experienced as the result of elevated levels of X-ray Flux.
Related Topics: Radio Communication | Aviation | Satellites | Flare Alerts
Options: Return to the Space Weather Tool | Open the Notifications Timeline to see current Alerts in a new window.
Proton Forecasts/Radio Communication
Proton forecasts indicate the percent chance that a proton event may occur during the following three days. Proton events are associated with impacts on HF radio propagation, resulting in fades at lower frequencies.
Proton forecasts are daily probabilistic forecasts, ranging from 1% to 99%, of the likelihood of greater than 10 MeV Proton Event occurring within the specified 24-hour day. The forecast does not specify the maximum expected Proton Flux; it provides the percentage chance that the 10 pfu (particle flux unit = particles / cm2-s-sr) threshold will be reached.
The following effects on Radio Communication are possible when the greater than 10 MeV Proton Flux is above:
- 10 pfu: Minor impacts on polar HF (high frequency) radio propagation resulting in fades at lower frequencies
- 102pfu: Small effects on polar HF (high frequency) propagation resulting in fades at lower frequencies
- 103pfu: Degraded or episodically blacked-out polar HF (high frequency) radio propagation
- 104pfu: Widespread blackout of polar HF (high frequency) communications likely
- 105pfu: Complete blackout of polar HF (high frequency) communications likely
The NOAA Space Weather Scale for Radiation Storms describes the effects that can be experienced as the result of elevated levels of proton radiation.
Related Topics: Radio Communication | Aviation | Satellites | Proton Forecasts
Options: Return to the Space Weather Tool | Open the 3-day Proton Event Probability Forecast in a new window.
Proton Alerts/Radio Communication
Proton alerts indicate that a proton event is currently in progress. Proton events are associated with impacts on HF radio propagation, resulting in fades at lower frequencies.
Proton Alerts/Summaries are disseminated when the greater than 10 MeV and 100 MeV Proton Flux reaches event thresholds.Greater than 10 MeV Proton Flux above:
- 10 pfu: Minor impacts on polar HF (high frequency) radio propagation resulting in fades at lower frequencies
- 102pfu: Small effects on polar HF (high frequency) propagation resulting in fades at lower frequencies
- 103pfu: Degraded or episodically blacked-out polar HF (high frequency) radio propagation
- 104pfu: Widespread blackout of polar HF (high frequency) communications likely
- 105pfu: Complete blackout of polar HF (high frequency) communications likely
Note: particle flux unit (pfu) = particles / cm2-s-sr
The NOAA Space Weather Scale for Radiation Storms describes the effects that can be experienced as the result of elevated levels of proton radiation.
Related Topics: Radio Communication | Aviation | Satellites | Proton Alerts
Options: Return to the Space Weather Tool | Open the Notifications Timeline to see current Alerts in a new window.
The aviation industry can be adversely impacted by space weather in the form of HF (high frequency) radio communications degradation, satellite navigation positioning errors, and potential biological hazards for aircrew in polar latitudes.
The NOAA Space Weather Scales for Geomagnetic Storms, Solar Radiation Storms and Radio Blackouts describe the effects that can be experienced in Aviation.
- Geomagnetic Storms (G Scale) can affect aviation through communication interruption or signal degradation and GPS positioning errors.
- Solar Radiation Storms (S Scale) can affect aviation due to communication interruption or signal degradation and can pose a biological hazard to flight crews or frequent flyers on polar routes.
- Radio Blackouts (R Scale) can affect aviation through communication interruption or signal degradation and GPS positioning errors.
Geomagnetic storms and solar flare producing radio blackouts impact HF communications and GPS navigation by changing the density and structure of Earth's ionosphere. Solar radiation storms impact HF communications in the polar regions and introduce increasing radiation exposure risks to the aircraft/astronaut environment, thus requiring mitigation measures.
Commercial aircraft rely on GPS and WAAS (Wide Area Augmentation System) for the purposes of navigation and increased vertical precision for approaches to landing. These systems, which include a network of geostationary satellites and ground-based stations, can be adversely affected by solar events and geomagnetic storms. Due to rapid variations in the ionosphere caused by the solar activity and scintillations of the satellite signals, this critical navigational information can be substantially degraded. In addition to the aircraft industry, other major users of GPS technologies have expanded into precision agriculture, mapping/surveying, construction, and oceanic drilling.
Related Topics: D-RAP | Flare Forecasts | Flare Alerts | Proton Forecasts | Proton Alerts | Geomagnetic Forecasts | ENLIL | Geomagnetic Alerts
Options: Return to the Space Weather Tool
The D-Region Absorption Predictions (D-RAP) Model is a quick reference visual tool that identifies regions that will experience signal degradation or radio blackout conditions due to effects from X-ray flares or Solar Energetic Particle (SEP) events.
The D-RAP Model addresses the operational impact of the solar X-ray flux and SEP events on Aviation due to degradation of High Frequency (HF) radio communication. It can be found at http://www.swpc.noaa.gov/products/d-region-absorption-predictions-d-rap
Four Dynamic Components associated with Radio Communication:
- Frequency Maps - The global and polar frequency maps graphically illustrate the Highest Affected Frequency (HAF) as a function of latitude and longitude.
- Attenuation Bar Graph - A bar graph on the right-hand side of the graphic displays the expected attenuation in decibels as a function of frequency for vertical radio wave propagation at the point of maximum absorption, Amax, on the globe. This graph is only valid at this point, although users can re-create it for any location using the tabular data.
- Status Messages - Text messages appear at the bottom of the frequency map describing the current levels of X-ray Flux and Proton Flux being observed.
- Estimated Recovery Clock - The program uses the current X-ray and proton flux data to re-calculate the estimated recovery time every minute.
Related Topics: Radio Communication | Aviation | D-RAP
Options: Return to the Space Weather Tool | Open the D-RAP Model in a new window.
Flare forecasts indicate the percent chance that a high level X-ray event may occur during the following three days. X-ray flares are associated with impacts on Aviation through problems with HF Communication (described on the Flare Forecasts/Radio Communication page) and Navigation Signal degradation, ranging from brief intervals to complete outages on the daylight side of the Earth for periods of minutes to hours (described below).
Flare forecasts are daily probabilistic forecasts, ranging from 1% to 99%, of the likelihood of an M-class or X-class X-ray flare occurring within the specified 24-hour day. The forecast does not specify the maximum expected X-ray Flux; it provides the percentage chance that M-class or X-class X-ray thresholds will be reached.
- M1 Flare (1x10⁻⁵ Watts / m2 ): Area of impact centered primarily on sub-solar point on the sunlit side of Earth. Weak or minor degradation of HF radio communication on sunlit side, occasional loss of radio contact. Low-frequency navigation signals degraded for brief intervals.
- M5 Flare (5x10⁻⁵ Watts / m2 ): Area of impact centered primarily on sub-solar point on the sunlit side of Earth. Limited blackout of HF (high frequency) radio communication for tens of minutes.
- X1 Flare (1x10⁻⁴ Watts / m2): Area of impact consists of large portions of the sunlit side of Earth, strongest at the sub-solar point; Wide area blackout of HF (high frequency) radio communication for about an hour.
- X10 Flare (1x10⁻³ Watts / m2): Area of impact widespread on the sunlit side of Earth, strongest at the sub-solar point; Minor disruptions of GNSS satellite navigation possible due to loss-of-lock and increased range errors for some applications; Wide area black out of HF (high frequency) radio communication for one to two hours.
- X20 Flare (2x10⁻³ Watts / m2): Area of impact largely the sunlit side of Earth, although strongest at the sub-solar point; Increased GNSS satellite navigation errors in positioning for several hours due to prolonged loss-of-lock and increased range errors for most applications; Complete HF (high frequency) radio blackout on the entire sunlit side of the Earth lasting for a number of hours. Higher radio frequencies may also be affected.
The NOAA Space Weather Scale for Radio Blackouts describes the effects that can be experienced as the result of elevated levels of X-ray Flux.
Related Topics: Radio Communication | Aviation | Flare Forecasts
Options: Return to the Space Weather Tool | Open the 3-day X-Ray Forecast in a new window.
Flare alerts indicate that a high level X-ray event is currently in progress. X-ray flares are associated with impacts on Aviation through problems with HF Communication (described on the Flare Alerts/Radio Communication page) and Navigation Signal degradation, ranging from brief intervals to complete outages on the daylight side of the Earth for a periods of minutes to hours (described below).
Flare Alerts are disseminated when the X-ray Flux has reached the M5 X-ray flare threshold of 5x10⁻⁵ Watts / m2 X-ray flux in the 0.1 to 0.8 nm passband as measured by the NOAA GOES spacecraft.
Flare Summaries are sent at the end of a significant flare event to notify customers of the maximum X- ray Flux reached.
- M1 Flare (1x10⁻⁵ Watts / m2 ): Area of impact centered primarily on sub-solar point on the sunlit side of Earth. Weak or minor degradation of HF radio communication on sunlit side, occasional loss of radio contact. Low-frequency navigation signals degraded for brief intervals.
- M5 Flare (5x10⁻⁵ Watts / m2 ): Area of impact centered primarily on sub-solar point on the sunlit side of Earth. Limited blackout of HF (high frequency) radio communication for tens of minutes.
- X1 Flare (1x10⁻⁴ Watts / m2): Area of impact consists of large portions of the sunlit side of Earth, strongest at the sub-solar point; Wide area blackout of HF (high frequency) radio communication for about an hour.
- X10 Flare (1x10⁻³ Watts / m2): Area of impact widespread on the sunlit side of Earth, strongest at the sub-solar point; Minor disruptions of GNSS satellite navigation possible due to loss-of-lock and increased range errors for some applications; Wide area black out of HF (high frequency) radio communication for one to two hours.
- X20 Flare (2x10⁻³ Watts / m2): Area of impact largely the sunlit side of Earth, although strongest at the sub-solar point; Increased GNSS satellite navigation errors in positioning for several hours due to prolonged loss-of-lock and increased range errors for most applications; Complete HF (high frequency) radio blackout on the entire sunlit side of the Earth lasting for a number of hours. Higher radio frequencies may also be affected.
The NOAA Space Weather Scale for Radio Blackouts describes the effects that can be experienced as the result of elevated levels of X-ray Flux that occur when the numbers of energetic particles increase.
Related Topics: Radio Communication | Aviation | Satellites | Flare Alerts
Options: Return to the Space Weather Tool | Open the Notifications Timeline to see current Alerts in a new window.
Proton forecasts indicate the percent chance that a proton event may occur during the following three days. Proton events are associated with impacts on HF radio propagation, resulting in fades at lower frequencies. They are also associated with increased risk for radiation exposure for aircrews and astronauts.
Proton forecasts are daily probabilistic forecasts, ranging from 1% to 99%, of the likelihood of a greater than 10 MeV Proton Event occurring within the specified 24-hour day. The forecast does not specify the maximum expected Proton Flux; rather, it provides the percentage chance that the 10 pfu (particle flux unit = particles / cm2-s-sr) threshold will be reached. The following effects are possible when the greater than 10 MeV Proton Flux is above:
- 10 pfu: Minor impacts on polar HF (high frequency) radio propagation resulting in fades at lower frequencies
- 102pfu: Small effects on polar HF (high frequency) propagation resulting in fades at lower frequencies; Passengers and crew in high latitude, high altitude flights may experience small, increased radiation exposures*
- 103pfu: Degraded or episodically blacked-out polar HF (high frequency) radio propagation; Passengers and crew in high latitude, high altitude flights may experience increasing radiation exposures. Astronauts on EVA (extra-vehicular activity) are exposed to elevated radiation levels *
- 104pfu: Widespread blackout of polar HF (high frequency) communications likely; Passengers and crew in high latitude, high altitude flights may experience significant radiation exposures. Astronauts on EVA (extra-vehicular activity) are exposed to unavoidable radiation hazard *
- 105pfu: Complete blackout of polar HF (high frequency) communications likely; Passengers and crew in high latitude, high altitude flights may experience significant radiation exposures. Astronauts on EVA (extra-vehicular activity) are exposed to unavoidable radiation hazard *
*High energy particle measurements (>100 MeV) are a better indicator of radiation risk to passenger and crews.
The NOAA Space Weather Scale for Radiation Storms describes the effects that can be experienced as the result of elevated levels of proton radiation.
Related Topics: Radio Communication | Aviation | Satellites | Proton Forecasts
Options: Return to the Space Weather Tool | Open the 3-day Proton Event Probability Forecast in a new window.
Proton alerts indicate that a proton event is currently in progress. Proton events are associated with impacts on HF radio propagation, resulting in fades at lower frequencies. They are also associated with increased risk for radiation exposure for aircrews and astronauts.
Proton Alerts are disseminated when the Proton Flux is 10, 102, 103, 104 and 10 5 pfu (particle flux unit = particles / cm2-s-sr) at greater than 10 MeV as measured by the NOAA GOES spacecraft.
A separate alert is issued when the Proton Flux is 1 pfu at greater than 100 MeV as measured by the NOAA GOES spacecraft.
Proton Summaries are sent at the end of a significant flare event to notify customers of the maximum Proton Flux reached during the event.
The following effects are possible when the greater than 10 MeV Proton Flux is above:
- 10 pfu: Minor impacts on polar HF (high frequency) radio propagation resulting in fades at lower frequencies
- 102pfu: Small effects on polar HF (high frequency) propagation resulting in fades at lower frequencies; Passengers and crew in high latitude, high altitude flights may experience small, increased radiation exposures*
- 103pfu: Degraded or episodically blacked-out polar HF (high frequency) radio propagation; Passengers and crew in high latitude, high altitude flights may experience increasing radiation exposures. Astronauts on EVA (extra-vehicular activity) are exposed to elevated radiation levels*
- 104pfu: Widespread blackout of polar HF (high frequency) communications likely; Passengers and crew in high latitude, high altitude flights may experience significant radiation exposures. Astronauts on EVA (extra-vehicular activity) are exposed to unavoidable radiation hazard*
- 105pfu: Complete blackout of polar HF (high frequency) communications likely; Passengers and crew in high latitude, high altitude flights may experience significant radiation exposures. Astronauts on EVA (extra-vehicular activity) are exposed to unavoidable radiation hazard*
*High energy particle measurements (>100 MeV) are a better indicator of radiation risk to passenger and crews.
The NOAA Space Weather Scale for Radiation Storms describes the effects that can be experienced as the result of elevated levels of proton radiation.
Related Topics: Radio Communication | Aviation | Satellites | Proton Alerts
Options: Return to the Space Weather Tool | Open the Notifications Timeline to see current Alerts in a new window.
Geomagnetic Forecasts/Aviation
Geomagnetic storm forecasts reveal the geomagnetic activity levels expected for the following three days. Geomagnetic storm events are associated with impacts on HF radio propagation (Airline Communication Issues) and satellite navigation (GNSS Positioning Errors).
Geomagnetic Storm Forecasts are daily forecasts, indicating the Planetary K-Index (Kp) value expected for each 3 hour synoptic period for the following 3 days.
- Kp>5: No impact on radio communications or satellite navigation
- Kp>6: HF radio propagation can fade at higher latitudes; no expected satellite navigation errors
- Kp>7: HF radio may be intermittent; intermittent satellite navigation (GNSS) problems, including loss-of-lock and increased range error may occur
- Kp>8: HF radio propagation sporadic or blacked out; satellite navigation (GNSS) degraded or inoperable for hours; low-frequency radio navigation disrupted
- Kp>9: HF radio propagation may be impossible in many areas for one to two days; satellite navigation (GNSS) may be degraded or unavailable for days; low-frequency radio navigation can be out for hours
The NOAA Space Weather Scale for Geomagnetic Storms describes the effects that can be experienced as the result of disturbances of the Earth's magnetic field caused by Coronal Mass Ejections (CMEs) or Coronal Hole High Speed Streams from the Sun.
Related Topics: Power Grids | Aviation | Satellites | GNSS | Aurora | | Geomagnetic Forecasts
Options: Return to the Space Weather Tool | Open Geomagnetic Activity Forecast in a new window.
Geomagnetic storm alerts indicate that a geomagnetic storm event is currently in progress. Geomagnetic storm events are associated with impacts on HF radio propagation (Airline Communication Issues) and satellite navigation (GNSS Positioning Errors).
Geomagnetic Storm Alerts are disseminated when the Planetary K-Index (Kp) value reaches each event threshold.
- Kp>5: No impact on radio communications or satellite navigation
- Kp>6: HF radio propagation can fade at higher latitudes; no expected satellite navigation errors
- Kp>7: HF radio may be intermittent; intermittent satellite navigation (GNSS) problems, including loss-of-lock and increased range error may occur
- Kp>8: HF radio propagation sporadic or blacked out; satellite navigation (GNSS) degraded or inoperable for hours; low-frequency radio navigation disrupted
- Kp>9: HF radio propagation may be impossible in many areas for one to two days; satellite navigation (GNSS) may be degraded or unavailable for days; low-frequency radio navigation can be out for hours
The NOAA Space Weather Scale for Geomagnetic Storms describes the effects that can be experienced as the result of disturbances of the Earth's magnetic field caused by Coronal Mass Ejections (CMEs) or Coronal Hole High Speed Streams from the Sun.
Related Topics: Radio Communication | Aviation | Satellites | Geomagnetic Alerts
Options: Return to the Space Weather Tool | Open Current Geomagnetic Activity Alerts in a new window.
Geomagnetic storm forecasts reveal the geomagnetic activity levels expected for the following three days. Geomagnetic storm events are associated with impacts on HF radio propagation (Airline Communication Issues) and satellite navigation (GNSS Positioning Errors).
The ENLIL model predicts solar wind stream variations for both Coronal Mass Ejections (CMEs) and Coronal Hole High Speed Streams. The magnitude and duration predicted by the model can assist forecasters in determining the magnitude and duration of associated geomagnetic storms along with ionospheric disturbances that may cause errors or complete loss of GNSS signals. For more information about the ENLIL model, visit http://www.swpc.noaa.gov/products/wsa-enlil-solar-wind-prediction.
Geomagnetic Storm Forecasts are daily forecasts, indicating the Planetary K-Index (Kp) value expected for each 3 hour synoptic period for the following 3 days.
- Kp>5: No impact on radio communications or satellite navigation
- Kp>6: HF radio propagation can fade at higher latitudes; no expected satellite navigation errors
- Kp>7: HF radio may be intermittent; intermittent satellite navigation (GNSS) problems, including loss-of-lock and increased range error may occur
- Kp>8: HF radio propagation sporadic or blacked out; satellite navigation (GNSS) degraded or inoperable for hours; low-frequency radio navigation disrupted
- Kp>9: HF radio propagation may be impossible in many areas for one to two days; satellite navigation (GNSS) may be degraded or unavailable for days; low-frequency radio navigation can be out for hours
The NOAA Space Weather Scale for Geomagnetic Storms describes the effects that can be experienced due to the impact on the Earth's magnetic field and ionosphere.
Related Topics: Power Grids | Aviation | Satellites | GNSS | Aurora | ENLIL
Options: Return to the Space Weather Tool | Open the ENLIL Model in a new window.
Power Grids and Induced Currents
Geomagnetic storm events are associated with impacts on power systems ranging from minor fluctuations to widespread voltage control problems.
- Kp>5: Area of impact primarily poleward of 60 degrees Geomagnetic Latitude. Induced Currents - Weak power grid fluctuations can occur
- Kp>6: Area of impact primarily poleward of 55 degrees Geomagnetic Latitude. Induced Currents - Power grid fluctuations can occur. High-latitude power systems may experience voltage alarms
- Kp>7: Area of impact primarily poleward of 50 degrees Geomagnetic Latitude. Induced Currents - Power system voltage irregularities possible, false alarms may be triggered on some protection devices
- Kp>8: Area of impact primarily poleward of 45 degrees Geomagnetic Latitude. Induced Currents - Possible widespread voltage control problems and some protective systems may mistakenly trip out key assets from the power grid. Induced pipeline currents intensify
- Kp>9: Area of impact primarily poleward of 40 degrees Geomagnetic Latitude. Induced Currents - Widespread voltage control problems and protective system problems may occur; some power grid systems may experience component failures or protective device trips resulting in blackouts or disruption of service. Pipeline currents can reach hundreds of amps
The NOAA Space Weather Scale for Geomagnetic Storms describes the effects that can be experienced as the result of disturbances of the Earth's magnetic field caused by Coronal Mass Ejections (CMEs) or Coronal Hole High Speed Streams from the Sun.
Related Topics: Geomagnetic Forecasts | ENLIL | Geomagnetic Alerts
Options: Return to the Space Weather Tool | Open the 3-day Geomagnetic Activity Forecast in a new window.
Geomagnetic Forecasts/Power Grids
Geomagnetic storm forecasts reveal the geomagnetic activity levels expected for the following three days. Geomagnetic storm events are associated with impacts on power systems ranging from minor fluctuations to widespread voltage control problems.
Geomagnetic Storm Forecasts are daily forecasts, indicating the Planetary K-Index (Kp) value expected for each 3 hour synoptic period for the following 3 days.
- Kp>5: Area of impact primarily poleward of 60 degrees Geomagnetic Latitude. Induced Currents - Weak power grid fluctuations can occur
- Kp>6: Area of impact primarily poleward of 55 degrees Geomagnetic Latitude. Induced Currents - Power grid fluctuations can occur. High-latitude power systems may experience voltage alarms>
- Kp>7: Area of impact primarily poleward of 50 degrees Geomagnetic Latitude. Induced Currents - Power system voltage irregularities possible, false alarms may be triggered on some protection devices
- Kp>8: Area of impact primarily poleward of 45 degrees Geomagnetic Latitude. Induced Currents - Possible widespread voltage control problems and some protective systems may mistakenly trip out key assets from the power grid. Induced pipeline currents intensify
- Kp>9: Area of impact primarily poleward of 40 degrees Geomagnetic Latitude. Induced Currents - Widespread voltage control problems and protective system problems may occur; some power grid systems may experience component failures or protective device trips resulting in blackouts or disruption of service. Pipeline currents can reach hundreds of amps
The NOAA Space Weather Scale for Geomagnetic Storms describes the effects that can be experienced as the result of disturbances of the Earth's magnetic field caused by Coronal Mass Ejections (CMEs) or Coronal Hole High Speed Streams from the Sun.
Related Topics: Power Grids | Aviation | Satellites | GNSS | Aurora | Geomagnetic Forecasts
Options: Return to the Space Weather Tool | Open Geomagnetic Activity Forecast in a new window.
Geomagnetic Alerts/Power Grids
Geomagnetic storm alerts indicate that a geomagnetic storm event is currently in progress. Geomagnetic storm events are associated with impacts on power systems ranging from minor fluctuations to widespread voltage control problems.
Geomagnetic Storm Alerts are disseminated when the Planetary K-Index (Kp) value reaches each event threshold.
- Kp>5: Area of impact primarily poleward of 60 degrees Geomagnetic Latitude. Induced Currents - Weak power grid fluctuations can occur
- Kp>6: Area of impact primarily poleward of 55 degrees Geomagnetic Latitude. Induced Currents - Power grid fluctuations can occur. High-latitude power systems may experience voltage alarms
- Kp>7: Area of impact primarily poleward of 50 degrees Geomagnetic Latitude. Induced Currents - Power system voltage irregularities possible, false alarms may be triggered on some protection devices
- Kp>8: Area of impact primarily poleward of 45 degrees Geomagnetic Latitude. Induced Currents - Possible widespread voltage control problems and some protective systems may mistakenly trip out key assets from the power grid. Induced pipeline currents intensify
- Kp>9: Area of impact primarily poleward of 40 degrees Geomagnetic Latitude. Induced Currents - Widespread voltage control problems and protective system problems may occur; some power grid systems may experience component failures or protective device trips resulting in blackouts or disruption of service. Pipeline currents can reach hundreds of amps
The NOAA Space Weather Scale for Geomagnetic Storms describes the effects that can be experienced as the result of disturbances of the Earth's magnetic field caused by Coronal Mass Ejections (CMEs) or Coronal Hole High Speed Streams from the Sun.
Related Topics: Power Grids | Aviation | Satellites | GNSS | Aurora | Geomagnetic Alerts
Options: Return to the Space Weather Tool | Open Current Geomagnetic Activity Alerts in a new window.
Geomagnetic storm forecasts reveal the geomagnetic activity levels expected for the following three days. Geomagnetic storm events are associated with impacts on power systems ranging from minor fluctuations to widespread voltage control problems.
The ENLIL model predicts solar wind stream variations for both Coronal Mass Ejections and Coronal Hole High Speed Streams. The magnitude and duration predicted by the model can assist forecasters in determining the magnitude and duration of associated geomagnetic storms. For more information about the ENLIL model, visit http://www.swpc.noaa.gov/products/wsa-enlil-solar-wind-prediction.
Geomagnetic Storm Forecasts are daily forecasts, indicating the Planetary K-Index (Kp) value expected for each 3 hour synoptic period for the following 3 days.
- Kp>5: Area of impact primarily poleward of 60 degrees Geomagnetic Latitude. Induced Currents - Weak power grid fluctuations can occur
- Kp>6: Area of impact primarily poleward of 55 degrees Geomagnetic Latitude. Induced Currents - Power grid fluctuations can occur. High-latitude power systems may experience voltage alarms
- Kp>7: Area of impact primarily poleward of 50 degrees Geomagnetic Latitude. Induced Currents - Power system voltage irregularities possible, false alarms may be triggered on some protection devices
- Kp>8: Area of impact primarily poleward of 45 degrees Geomagnetic Latitude. Induced Currents - Possible widespread voltage control problems and some protective systems may mistakenly trip out key assets from the power grid. Induced pipeline currents intensify
- Kp>9: Area of impact primarily poleward of 40 degrees Geomagnetic Latitude. Induced Currents - Widespread voltage control problems and protective system problems may occur; some power grid systems may experience component failures or protective device trips resulting in blackouts or disruption of service. Pipeline currents can reach hundreds of amps
The NOAA Space Weather Scale for Geomagnetic Storms describes the effects that can be experienced as the result of disturbances of the Earth's magnetic field caused by Coronal Mass Ejections (CMEs) or Coronal Hole High Speed Streams from the Sun.
Related Topics: Power Grids | Aviation | Satellites | GNSS | Aurora | ENLIL
Options: Return to the Space Weather Tool | Open the ENLIL Model in a new window.
Satellites in space are exposed to a harsh and highly variable particle environment, and satellite signals can be disrupted by solar radio bursts and by disturbances in the ionosphere. In addition, satellite orbit trajectories can be altered by changes in the thermospheric density.
Spacecraft charging: Spacecraft charging is one of the most common types of anomalies caused by the radiation environment. It results from the build-up of electrical charge and its subsequent discharge or arching. There are two categories of spacecraft charging: surface charging and deep-dielectric charging. Surface charging is associated with increased fluxes of low energy electrons (< 100 keV) caused by geomagnetic activity. Deep-dielectric charging is associated with energetic electrons (> 100 keV) that are able to penetrate into spacecraft components and cause internal charge build-up.
Single-event upset: A single-event upset (SEU) is a disruption of the proper functioning of an electronic circuit due to ionization within a circuit component from penetrating energetic particles. SEUs are typically caused by energetic (greater than 10 MeV) protons or heavy ions.
Satellite drag: Geomagnetic storms and increased solar ultraviolet emission heat the Earth’s upper atmosphere, causing it to expand. This results in increased drag on satellites in space, causing them to slow and change orbit slightly.
Satellite communication: Ionospheric disturbances, including those driven by geomagnetic storms, can cause signal scattering and absorption that degrade satellite communication. In addition, solar radio bursts associated with solar flares can increase the noise level in a receiving antenna and degrade satellite communication, including the reception of satellite-navigation signals.
Satellite orientation: Solar energetic particles can degrade the accuracy of star-tracking systems used for satellite orientation, and geomagnetic storms can degrade the accuracy of satellite orientation systems that rely on the ambient magnetic field.
The NOAA Space Weather Scales for Geomagnetic Storms, Solar Radiation Storms and Radio Blackouts describe the effects that can be experienced on Satellites as the result of space weather conditions.
- Geomagnetic Storms (G Scale) can increase the satellite surface charging hazard, they can increase the orbital drag, they can cause ionospheric disturbances that degrade satellite communication, and they can degrade the accuracy of satellite orientation systems that depend on the ambient magnetic field.
- Solar Radiation Storms (S Scale) can increase the risk of single event upsets in satellite electronics, they can degrade the accuracy of star-tracking systems for satellite orientation, and they can cause the degradation of solar panel efficiency.
- Radio Blackouts (R Scale) can increase the noise levels in receiving antennas and degrade satellite communication.
Related Topics: Flare Alerts | Proton Forecasts | Proton Alerts | Geomagnetic Forecasts | ENLIL | Geomagnetic Alerts | GNSS | REFM | 2MeV Alerts
Options: Return to the Space Weather Tool
Flare alerts indicate that a high level X-ray event is currently in progress. X-ray flares can be associated with satellite communication and navigation signal degradation,.
Flare Alerts are disseminated when the X-ray Flux has reached the M5 X-ray flare threshold of 5x10⁻⁵ Watts / m2 X-ray flux in the 0.1 to 0.8 nm passband as measured by the NOAA GOES spacecraft.
Flare Summaries are sent at the end of a significant flare event to notify customers of the maximum X- ray Flux reached.
The NOAA Space Weather Scale for Radio Blackouts describes the effects that can be experienced as the result of elevated levels of X-ray Flux.
Related Topics: Radio Communication | Aviation | GNSS | Flare Alerts
Options: Return to the Space Weather Tool | Open the Notifications Timeline to see current Alerts in a new window..
Proton forecasts indicate the percent chance that a proton event may occur during the following three days. Proton events are associated with increased single-event upsets in satellite electronics, solar panel degradation, noise in imaging systems, and errors in star-tracker orientation systems.
Proton forecasts are daily probabilistic forecasts, ranging from 1% to 99%, of the likelihood of a greater than 10 MeV Proton Event occurring within the specified 24-hour day. The forecast does not specify the maximum expected Proton Flux; rather, it provides the percentage chance that the 10 pfu (particle flux unit = particles / cm2-s-sr) threshold will be reached.The following effects are possible when the greater than 10 MeV Proton Flux is above:
- 10 pfu: No impact on satellite operations
- 102pfu: Infrequent single-event upsets to satellites are possible
- 103pfu: Single-event upsets to satellite operations, noise in imaging systems, and slight reduction of efficiency in solar panels are likely
- 104pfu: Satellites may experience memory device problems and noise on imaging systems; star-trackers may cause orientation problems; solar panel efficiency may be degraded
- 105pfu: Satellites may experience significant memory device problems and noise on imaging systems; star-trackers may be unable to locate sources; permanent damage to solar panels possible; inability to control navigation systems possible
The NOAA Space Weather Scale for Radiation Storms describes the effects that can be experienced as the result of elevated levels of proton radiation.
Related Topics: Radio Communication | Aviation | Satellites | Proton Forecasts
Options: Return to the Space Weather Tool | Open the 3-day Proton Event Probability Forecast in a new window.
Proton alerts indicate that a proton event is currently in progress. Proton events are associated with impacts on HF radio propagation, resulting in fades at lower frequencies. They are also associated with increased risk for interruption to satellite operations.
Proton Alerts are disseminated when the Proton Flux is 10, 102, 103, 104 and 10 5 pfu (particle flux unit = particles / cm2-s-sr) at greater than 10 MeV as measured by the NOAA GOES spacecraft.
A separate alert is issued when the Proton Flux is 1 pfu at greater than 100 MeV as measured by the NOAA GOES spacecraft.
Proton Summaries are sent at the end of a significant flare event to notify customers of the maximum Proton Flux reached during the event.
The following effects are possible when the greater than 10 MeV proton flux is above:
- 10 pfu: No impact on satellite operations
- 102pfu: Infrequent single-event upsets to satellites are possible
- 103pfu: Single-event upsets to satellite operations, noise in imaging systems, and slight reduction of efficiency in solar panels are likely
- 104pfu: Satellites may experience memory device problems and noise on imaging systems; star-trackers may cause orientation problems; solar panel efficiency may be degraded
- 105pfu: Satellites may experience significant memory device problems and noise on imaging systems; star-trackers may be unable to locate sources; permanent damage to solar panels possible; inability to control navigation systems possible
The NOAA Space Weather Scale for Radiation Storms describes the effects that can be experienced as the result of elevated levels of radiation.
Related Topics: Radio Communication | Aviation | Satellites | Proton Alerts
Options: Return to the Space Weather Tool | Open the Notifications Timeline to see current Alerts in a new window..
Geomagnetic Forecasts/Satellites
Geomagnetic storm forecasts reveal the geomagnetic activity levels expected for the following three days. Geomagnetic storm events are associated with impacts on satellite surface charging, degraded satellite communication, and orbital drag.
Geomagnetic Storm Forecasts are daily forecasts, indicating the Planetary K-Index (Kp) value expected for each 3 hour synoptic period for the following 3 days.
- Kp>5: Minor impact on satellite operations possible
- Kp>6: Satellite orientation irregularities may occur; increased drag on low Earth-orbit satellites is possible
- Kp>7: Systems may experience surface charging; increased drag on low Earth-orbit satellites and orientation problems may occur
- Kp>8: Systems may experience surface charging; increased drag on low earth orbit satellites, and tracking and orientation problems may occur
- Kp>9: Systems may experience anomalies to include: extensive surface charging, unexpected orientation and attitude changes, uplink/downlink errors, and satellite orbit degradation
The NOAA Space Weather Scale for Geomagnetic Storms describes the effects that can be experienced as the result of disturbances of the Earth's magnetic field caused by Coronal Mass Ejections (CMEs) or Coronal Hole High Speed Streams from the Sun.
Related Topics: Power Grids | Aviation | Satellites | GNSS | Aurora | Geomagnetic Forecasts
Options: Return to the Space Weather Tool | Open Geomagnetic Activity Forecast in a new window.
Geomagnetic storm alerts indicate that a geomagnetic storm event is currently in progress. Geomagnetic storm events are associated with increased satellite surface charging, degraded satellite communication, and orbital drag.
Geomagnetic Storm Alerts are disseminated when the Planetary K-Index (Kp) value reaches each event thresholds.
- Kp>5: Minor impact on satellite operations possible
- Kp>6: Satellite orientation irregularities may occur; increased drag on low Earth-orbit satellites is possible
- Kp>7: Systems may experience surface charging; increased drag on low Earth-orbit satellites and orientation problems may occur
- Kp>8: Systems may experience surface charging; increased drag on low earth orbit satellites, and tracking and orientation problems may occur
- Kp>9: Systems may experience anomalies to include: extensive surface charging, unexpected orientation and attitude changes, uplink/downlink errors, and satellite orbit degradation
The NOAA Space Weather Scale for Geomagnetic Storms describes the effects that can be experienced as the result of disturbances of the Earth's magnetic field caused by Coronal Mass Ejections (CMEs) or Coronal Hole High Speed Streams from the Sun.
Related Topics: Power Grids | Aviation | Satellites | GNSS | Aurora | Geomagnetic Alerts
Options: Return to the Space Weather Tool | Open Current Geomagnetic Activity Alerts in a new window.
Geomagnetic storm forecasts reveal the geomagnetic activity levels expected for the following three days. Geomagnetic storm events are associated with increased satellite surface charging, degraded satellite communication, and orbital drag.
The ENLIL model predicts solar wind stream variations for both Coronal Mass Ejections (CMEs) and Coronal High Speed Streams. The magnitude and duration predicted by the model can assist forecasters in determining the magnitude and duration of associated geomagnetic storms. For more information about the ENLIL model, visit http://www.swpc.noaa.gov/products/wsa-enlil-solar-wind-prediction.
Geomagnetic Storm Forecasts are daily forecasts, indicating the Planetary K-Index (Kp) value expected for each 3 hour synoptic period for the following 3 days.
- Kp>5: Minor impact on satellite operations possible
- Kp>6: Satellite orientation irregularities may occur; increased drag on low Earth-orbit satellites is possible
- Kp>7: Systems may experience surface charging; increased drag on low Earth-orbit satellites and orientation problems may occur
- Kp>8: Systems may experience surface charging; increased drag on low earth orbit satellites, and tracking and orientation problems may occur
- Kp>9: Systems may experience anomalies to include: extensive surface charging, unexpected orientation and attitude changes, uplink/downlink errors, and satellite orbit degradation
The NOAA Space Weather Scale for Geomagnetic Storms describes the effects that can be experienced as the result of disturbances of the Earth's magnetic field caused by Coronal Mass Ejections (CMEs) or Coronal Hole High Speed Streams from the Sun.
Related Topics: Power Grids | Aviation | Satellites | GNSS | Aurora | ENLIL
Options: Return to the Space Weather Tool | Open the ENLIL Model in a new window.
Relativistic Electron Forecast Model/Satellites
Satellites can experience deep dielectric or bulk charging when the Earth is immersed in a high speed solar wind stream. The Van Allen belts become populated with high fluxes of relativistic (>1 MeV) electrons. These electrons easily penetrate spacecraft shielding and can build up charge where they come to rest in dielectrics such as coax cable, circuit boards, electrically floating radiation shields, etc. If the electron flux is high for extended periods, abrupt discharges (tiny "lightening strokes") deep in the spacecraft can occur. The Relativistic Electron Forecast Model (REFM) uses solar wind data upstream from Earth to forecast electron flux levels expected over the next 3 days.
High fluxes of energetic electrons vary with the 11 year solar cycle and are most prevalent during the declining phase of the cycle. Occasionally, high-energy electron events recur with a 27-day periodicity - the rotation period of the Sun. Discharges appear to correlate well with long periods of high fluxes. At these times, charge buildup exceeds the natural charge leakage rate of the dielectric. The charge builds and discharge occurs after the breakdown voltage is reached. In the past, some energetic electron enhancements at GEO have approached two weeks in duration.
REFM forecasts are intended to supplement current SWPC alerts by providing guidance as to the future likelihood of damaging relativistic electron events. Since the REFM output is a daily fluence forecast, not flux, it applies most directly to the high fluence threshold. In fact the graphical model output displays a warning message during periods when the 72-hour fluence exceeds or is forecast to exceed 109 particles/(cm2 sr day).
High 24-hour fluence values can also be used as a proxy for high flux levels. A study of data measured between 1995 and 2000 showed that when the 24-hour fluence exceeds 3 × 10⁷ particles/(cm2 sr day) the SWPC flux alert criteria is nearly always met (false alarm ratio = 0.07, miss frequency = 0.06). With this threshold, REFM fluence forecasts can be used to predict SWPC flux alerts.
Related Topics: Satellites | REFM | Geomagnetic Forecasts | Geomagnetic Alerts | ENLIL | Flare Alerts | Proton Forecasts | Proton Alerts
Options: Return to the Space Weather Tool | Open the Relativistic Electron Forecast Model in a new window.
> 2 MeV Electron Alerts/Satellites
Satellites can experience deep dielectric or bulk charging when the Earth is immersed in a high speed solar wind stream. The Van Allen belts become populated with high fluxes of relativistic (>1 MeV) electrons. These electrons easily penetrate spacecraft shielding and can build up charge where they come to rest in dielectrics such as coax cable, circuit boards, electrically floating radiation shields, etc. If the electron flux is high for extended periods, abrupt discharges (tiny "lightening strokes") deep in the spacecraft can occur.
High fluxes of these electrons vary with the 11 year solar cycle and are most prevalent during the declining phase of the cycle. Occasionally, high-energy electron events recur with a 27-day periodicity - the rotation period of the Sun. Discharges appear to correlate well with long periods of high fluxes. At these times, charge buildup exceeds the natural charge leakage rate of the dielectric. The charge builds and discharge occurs after the breakdown voltage is reached. In the past, some energetic electron enhancements at GEO have approached two weeks in duration.
SWPC operates electron flux sensors on the GOES GEO spacecraft. These instruments measure electron fluxes of >0.8 and >2 MeV. (See GOES electron data)
A greater than 2 MeV Electron Alert is issued when the 1000 pfu (particle flux unit = particles / cm2-s-sr) threshold is crossed.
Related Topics: Satellites | 2MeV Alerts
Options: Return to the Space Weather Tool | Open the GOES Electron Data in a new window.
GNSS (Global Navigation Satellite System)
Geomagnetic Storms and Radio Blackouts are associated with Navigation Signal degradation, ranging from brief intervals to complete outages on the daylight side of the Earth for a periods of minutes to hours. Electron density variability is also associated with GNSS positioning errors making Total Electron Content (US-TEC) important information for GPS users.
- Geomagnetic Storms (G Scale) can cause GNSS signal degradation andpositioning errors.
- Radio Blackouts (R Scale) can cause GNSS signal degradation and positioning errors on the sunlit side of the Earth.
The NOAA Space Weather Scales for Geomagnetic Storms and Radio Blackouts describe the effects that can be experienced on GNSS as the result of space weather conditions.
Related Topics: Flare Alerts |Geomagnetic Forecasts | ENLIL | Geomagnetic Alerts | Satellites | USTEC
Options: Return to the Space Weather Tool
US Total Electron Content/GNSS
Electron density is an important ionospheric parameter for GNSS users. All single-frequency GNSS receivers must correct for the delay of the signal as it propagates through the ionosphere from GNSS satellites (~22,000 km altitude). The signals from GPS and the other navigation systems (Glonass, COMPASS, Galileo, et al) are affected by turbulence in the ionosphere and changes in the Total Electron Content (TEC). Space weather events can produce strong gradients in density. US TEC is a measure of the variability in TEC over the United States.
 Global Navigation Satellite Systems (GNSS) are an integral part of many applications including transportation, farming, and precision drilling. Before reaching a receiver, however, transmissions from these satellites must pass through the Earth’s ionosphere. This region of plasma envelops the Earth from beyond 1000 km down to approximately 60 km and is formed primarily through photo–ionization, but subject to other processes.
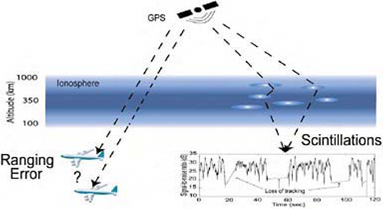
The ionospheric plasma refracts the GNSS transmission, delaying the arrival of the carrier wave and leading to ranging error (see figure above courtesy of Paul Kintner). In the absence of space weather events like flares and geomagnetic storms, ionospheric path delay occurs in a manner that is usually reasonably predicted and ameliorated. In fact, it can be exploited to estimate the integrated number density of electrons in a column with a one square meter cross sectional area extending from the receiver to the satellite called the Total Electron Content (TEC). This is exactly what the US TEC product does over the continental United States, assimilating data from a network of duel frequency GPS receivers to produce TEC and slant path maps. These maps can then be used to estimate the signal delay, and hence the receiver location error, arising from the ionospheric electron content.
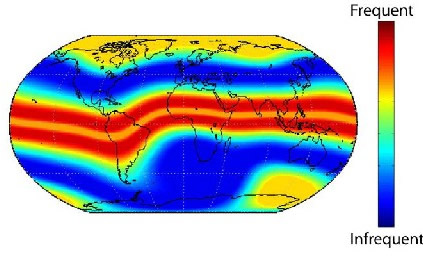 In contrast to the relatively predictable nature of the quiet ionosphere, space weather events like geomagnetic storms can produce strong gradients in electron density and small-scale spatial variations in refractive index, leading to a phenomenon called scintillation. Scintillation causes large fluctuations in signal amplitude and phase, degraded GNSS performance, and in extreme cases can render GNSS unavailable. Scintillation frequently occurs in bands north and south of the geomagnetic equator, reaching a peak at solar maximum. It also occurs at the poles (see figure on the right courtesy of Paul Kintner). Additionally, solar radio bursts associated with flares can interfere with GNSS signals causing outages.
The impact of Geomagnetic Storms on GNSS devices is discussed separately on the Geomagnetic Alerts - GNSS page.
Related Topics: Geomagnetic Forecasts | ENLIL | Geomagnetic Alerts | Flare Alerts
Options: Return to the Space Weather Tool | Open the Real-time US-Total Electron Content: Vertical and Slant in a new window.
Geomagnetic storm forecasts indicate the percent chance that a geomagnetic storm event may occur during the following three days and at what level. Geomagnetic storm events are associated with impacts on satellite navigation.
Geomagnetic Storm Forecasts are daily forecasts, indicating the Planetary K-Index (Kp) value expected for each 3 hour synoptic period for the following 3 days.
The largest error source for single-frequency GNSS is due to discontinuities in the ionosphere. The weak signal transmitted by the satellites must pass through the free electrons in the ionosphere en route to the ground. If the ionosphere is irregular or turbulent, the signal will be altered or even become unusable.
- Kp>5: Minor impact on satellite operations possible
- Kp>6: Satellite orientation irregularities may occur; increased drag on low Earth-orbit satellites is possible
- Kp>7: Systems may experience surface charging; increased drag on low Earth-orbit satellites and orientation problems may occur; intermittent satellite navigation (GNSS) problems , including loss-of-lock and increased range error may occur
- Kp>8: Systems may experience surface charging; increased drag on low earth orbit satellites, and tracking and orientation problems may occur; satellite navigation (GNSS) degraded or inoperable for hours
- Kp>9: Systems may experience anomalies to include: extensive surface charging, unexpected orientation and attitude changes, uplink/downlink errors, and satellite orbit degradation; satellite navigation (GNSS) may be degraded or unavailable for days
The NOAA Space Weather Scale for Geomagnetic Storms describes the effects that can be experienced as the result of disturbances of the Earth's magnetic field caused by Coronal Mass Ejections (CMEs) or Coronal Hole High Speed Streams from the Sun.
Related Topics: Power Grids | Aviation | Satellites | GNSS | Aurora | Geomagnetic Forecasts
Options: Return to the Space Weather Tool | Open Geomagnetic Activity Forecast in a new window.
Geomagnetic storm alerts indicate that a geomagnetic storm event is currently in progress. Geomagnetic storm events are associated with impacts on satellite navigation.
Geomagnetic Storm Alerts are disseminated when the Planetary K-Index (Kp) value reaches each event thresholds.
The largest error source for single-frequency GNSS is due to discontinuity in the ionosphere. The weak signal transmitted by the satellite must pass through the free electrons in the ionosphere en route to the ground. If the ionosphere is irregular or turbulent, the signal will be altered or even become unusable.
- Kp>5: Minor impact on satellite operations possible
- Kp>6: Satellite orientation irregularities may occur; increased drag on low Earth-orbit satellites is possible
- Kp>7: Systems may experience surface charging; increased drag on low Earth-orbit satellites and orientation problems may occur; intermittent satellite navigation (GNSS) problems , including loss-of-lock and increased range error may occur
- Kp>8: Systems may experience surface charging; increased drag on low earth orbit satellites, and tracking and orientation problems may occur; satellite navigation (GNSS) degraded or inoperable for hours
- Kp>9: Systems may experience anomalies to include: extensive surface charging, unexpected orientation and attitude changes, uplink/downlink errors, and satellite orbit degradation; satellite navigation (GNSS) may be degraded or unavailable for days
The NOAA Space Weather Scale for Geomagnetic Storms describes the effects that can be experienced as the result of disturbances of the Earth's magnetic field caused by Coronal Mass Ejections (CMEs) or Coronal Hole High Speed Streams from the Sun.
Related Topics: Power Grids | Aviation | Satellites | GNSS | Aurora | Geomagnetic Alerts
Options: Return to the Space Weather Tool | Open Current Geomagnetic Activity Alerts in a new window.
The ENLIL model can assist forecasters in predicting the occurrence of geomagnetic activity, which can lead to ionospheric disturbances that may affect GNSS users.
The largest error source for single-frequency GNSS is due to discontinuities in the ionosphere. The weak signal transmitted by the satellite must pass through the free electrons in the ionosphere en route to the ground. If the ionosphere is irregular or turbulent, the signal will be altered or even become unusable.
The largest error source for single-frequency GNSS is due to discontinuities in the ionosphere. The weak signal transmitted by the satellite must pass through the free electrons in the ionosphere en route to the ground. If the ionosphere is irregular or turbulent, the signal will be altered or even become unusable.
The ENLIL model predicts solar wind stream variations for both Coronal Mass Ejections (CMEs) and Coronal Hole High Speed Streams, which can lead to enhanced geomagnetic activity. The magnitude and duration predicted by the model can assist forecasters in determining the magnitude and duration of associated disturbances in the ionosphere. For more information about the ENLIL model, visit http://www.swpc.noaa.gov/products/wsa-enlil-solar-wind-prediction.
The impact of Geomagnetic Storms on GNSS devices is discussed separately on the Geomagnetic Storm Alerts - GNSS page.
Related Topics: Geomagnetic Forecasts | Geomagnetic Alerts | US TEC | ENLIL
Options: Return to the Space Weather Tool | Open the ENLIL Model in a new window.
When geomagnetic activity is low, the aurora borealis typically is located, in the hours around midnight, at about 67 degrees corrected magnetic latitude. As activity increases, the region of aurora expands toward the equator. When geomagnetic activity is very high, the aurora may be seen at mid and low latitude locations around the Earth that would otherwise rarely experience the polar lights.
 The aurora is a dynamic and visually delicate manifestation of solar-induced geomagnetic storms. The solar wind energizes electrons and ions in the magnetosphere. These particles usually enter the Earth’s upper atmosphere near the polar regions. When the particles strike the molecules and atoms of the thin, high atmosphere, some of them start to glow in different colors. Aurora begin between 60 and 80 degrees latitude. As a storm intensifies, the aurora spread toward the equator. During an unusually large storm in 1909, an aurora was visible at Singapore, on the geomagnetic equator. The aurora provide pretty displays, but they are just a visible sign of atmospheric changes that may wreak havoc on technological systems.
- Kp>5: Aurora is commonly visible at high latitudes (northern Michigan and Maine)
- Kp>6: Aurora has been seen as low as New York and Idaho (typically 55° geomagnetic latitude)
- Kp>7: Intermittent aurora has been seen as low as Illinois and Oregon (typically 50° geomagnetic latitude)
- Kp>8: Aurora has been seen as low as Alabama and northern California (typically 45° geomagnetic latitude)
- Kp>9: Aurora has been seen as low as Florida and southern Texas (typically 40° geomagnetic latitude)
The NOAA Space Weather Scale for Geomagnetic Storms describes the effects that can be experienced as the result of disturbances of the Earth's magnetic field caused by Coronal Mass Ejections (CMEs) or Coronal Hole High Speed Streams from the Sun.
Related Topics: Geomagnetic Forecasts | ENLIL | Geomagnetic Alerts | Solar Cycle Update
Options: Return to the Space Weather Tool
Geomagnetic storm forecasts reveal the geomagnetic activity levels expected for the following three days. When geomagnetic activity is low, the aurora borealis typically is located, in the hours around midnight, at about 67 degrees corrected magnetic latitude. As activity increases, the region of aurora expands toward the equator. When geomagnetic activity is very high, the aurora may be seen at mid and low latitude locations around the Earth that would otherwise rarely experience the polar lights.
Geomagnetic Storm Forecasts are daily forecasts, indicating the Planetary K-Index (Kp) value expected for each 3 hour synoptic period for the following 3 days.
- Kp>5: Aurora is commonly visible at high latitudes (northern Michigan and Maine)
- Kp>6: Aurora has been seen as low as New York and Idaho (typically 55° geomagnetic latitude)
- Kp>7: Intermittent aurora has been seen as low as Illinois and Oregon (typically 50° geomagnetic latitude)
- Kp>8: Aurora has been seen as low as Alabama and northern California (typically 45° geomagnetic latitude)
- Kp>9: Aurora has been seen as low as Florida and southern Texas (typically 40° geomagnetic latitude)
The NOAA Space Weather Scale for Geomagnetic Storms describes the effects that can be experienced as the result of disturbances of the Earth's magnetic field caused by Coronal Mass Ejections (CMEs) or Coronal Hole High Speed Streams from the Sun.
Related Topics: Power Grids | Aviation | Satellites | GNSS | Aurora | Geomagnetic Forecasts
Options: Return to the Space Weather Tool | Open Geomagnetic Activity Forecast in a new window.
Geomagnetic storm alerts indicate that a geomagnetic storm event is currently in progress. When geomagnetic activity is low, the aurora borealis typically is located, in the hours around midnight, at about 67 degrees corrected magnetic latitude. As activity increases, the region of aurora expands toward the equator. When geomagnetic activity is very high, the aurora may be seen at mid and low latitude locations around the Earth that would otherwise rarely experience the polar lights.
Geomagnetic Storm Alerts are disseminated when the Planetary K-Index (Kp) value reaches each event threshold.
- Kp>5: Aurora is commonly visible at high latitudes (northern Michigan and Maine)
- Kp>6: Aurora has been seen as low as New York and Idaho (typically 55° geomagnetic latitude)
- Kp>7: Intermittent aurora has been seen as low as Illinois and Oregon (typically 50° geomagnetic latitude)
- Kp>8: Aurora has been seen as low as Alabama and northern California (typically 45° geomagnetic latitude)
- Kp>9: Aurora has been seen as low as Florida and southern Texas (typically 40° geomagnetic latitude)
The NOAA Space Weather Scale for Geomagnetic Storms describes the effects that can be experienced as the result of disturbances of the Earth's magnetic field caused by Coronal Mass Ejections (CMEs) or Coronal Hole High Speed Streams from the Sun.
Related Topics: Power Grids | Aviation | Satellites | GNSS | Aurora | Geomagnetic Alerts
Options: Return to the Space Weather Tool | Open Current Geomagnetic Activity Alerts in a new window.
Geomagnetic storm forecasts reveal the geomagnetic activity levels expected for the following three days. When geomagnetic activity is low, the aurora borealis typically is located, in the hours around midnight, at about 67 degrees corrected magnetic latitude. As activity increases, the region of aurora expands toward the equator. When geomagnetic activity is very high, the aurora may be seen at mid and low latitude locations around the Earth that would otherwise rarely experience the polar lights.
The ENLIL model predicts solar wind stream variations for both Coronal Mass Ejections (CMEs) and Coronal Hole High Speed Streams. The magnitude and duration predicted by the model can assist forecasters in determining the magnitude and duration of associated geomagnetic storms. For more information about the ENLIL model, visit http://www.swpc.noaa.gov/products/wsa-enlil-solar-wind-prediction.
Geomagnetic Storm Forecasts are daily forecasts, indicating the Planetary K-Index (Kp) value expected for each 3 hour synoptic period for the following 3 days.
- Kp>5: Aurora is commonly visible at high latitudes (northern Michigan and Maine)
- Kp>6: Aurora has been seen as low as New York and Idaho (typically 55° geomagnetic latitude)
- Kp>7: Intermittent aurora has been seen as low as Illinois and Oregon (typically 50° geomagnetic latitude)
- Kp>8: Aurora has been seen as low as Alabama and northern California (typically 45° geomagnetic latitude)
- Kp>9: Aurora has been seen as low as Florida and southern Texas (typically 40° geomagnetic latitude)
The NOAA Space Weather Scale for Geomagnetic Storms describes the effects that can be experienced as the result of disturbances of the Earth's magnetic field caused by Coronal Mass Ejections (CMEs) or Coronal Hole High Speed Streams from the Sun.
Related Topics: Power Grids | Aviation | Satellites | GNSS | Aurora | ENLIL
Options: Return to the Space Weather Tool | Open the ENLIL Model in a new window.
Solar activity has a cycle with a duration of approximately 11 years from peak to peak (5.5 years from maximum to minimum). This includes changes in the levels of solar radiation and ejection of solar material due largely to changes in the size, magnetic complexity and prevalence of active sunspot regions. When geomagnetic activity is low, the aurora borealis typically is located, in the hours around midnight, at about 67 degrees corrected magnetic latitude. As activity increases, the region of aurora expands toward the equator. When geomagnetic activity is very high, the aurora may be seen at mid and low latitude locations around the Earth that would otherwise rarely experience the polar lights.
- Kp>5: Aurora is commonly visible at high latitudes (northern Michigan and Maine)
- Kp>6: Aurora has been seen as low as New York and Idaho (typically 55° geomagnetic latitude)
- Kp>7: Intermittent aurora has been seen as low as Illinois and Oregon (typically 50° geomagnetic latitude)
- Kp>8: Aurora has been seen as low as Alabama and northern California (typically 45° geomagnetic latitude)
- Kp>9: Aurora has been seen as low as Florida and southern Texas (typically 40° geomagnetic latitude)
The NOAA Space Weather Scale for Geomagnetic Storms describes the effects that can be experienced as the result of disturbances of the Earth's magnetic field caused by Coronal Mass Ejections (CMEs) or Coronal Hole High Speed Streams from the Sun.
Related Topics: ENLIL | Geomagnetic Alerts | Geomagnetic Forecasts | Aurora
Options: Return to the Space Weather Tool | Open the ISES Solar Cycle Progression Chart in a new window.